
Determination of Oxytetracycline Absorption and Effectiveness against Aeromonas salmonicidain Rainbow Trout (Oncorhynchus mykiss)
Ron A. Miller1*, Francis R. Pelsor1, Junshan Qiu2, Andrew S. Kane3, Renate Reimschuessel4
Affiliation
- 1Office of New Animal Drug Evaluation, Center for Veterinary Medicine, Food and Drug Administration, USA
- 2Office of Translational Sciences, Center for Drug Evaluation and Research, Food and Drug Administration, USA
- 3Aquatic Pathobiology Laboratory, Department of Environmental and Global Health, College of Public Health and Health Professions, University of Florida, USA
- 4Office of Research, Center for Veterinary Medicine, Food and Drug Administration, USA
Corresponding Author
Ron A. Miller, Office of New Animal Drug Evaluation, Center for Veterinary Medicine, Food and Drug Administration, 7500 Standish Place Rockville, MD 20855, USA, Tel: +240-402-0795; E-mail: ron.miller@fda.hhs.gov
Citation
Miller, R.A., et al. Determination of Oxytetracycline Absorption and Effectiveness against Aeromonas salmonicidain Rainbow Trout (Oncorhynchus mykiss). (2016) J Vet Sci Animal Welf 1(1):1- 9.
Copy rights
© 2016 Miller, R.A. This is an Open access article distributed under the terms of Creative Commons Attribution 4.0 International License.
Keywords
Oxytetracycline; Furunculosis; Aeromonas salmonicida; Oncorhynchus mykiss
Abstract
This study determined the effectiveness and oral absorption of oxytetracycline (OTC) in rainbow trout (Oncorhynchus mykiss) experimentally infected with an Aeromonas salmonicida challenge strain (MIC = 0.25 μg/mL). The FDA-approved OTC-medicated feed regimen was shown to be highly efficacious. A follow-up parallel study revealed a clear and direct correlation between serum OTC and serum total protein (TP) concentrations in A. salmonicida-challenged rainbow trout 1, 3, 4, 6, and 10 days after medicated dosing began. Mean serum OTC concentrations collected at various time points during the dosing regimen were lower in A.salmonicida-challenged rainbow trout than previously shown in healthy uninfected trout.
Introduction
Many researchers have studied the oxytetracycline (OTC) pharmacokinetic profile following oral administration in multiple aquatic animal species including shrimp[1-5], sea turtles[6], and fish[7-11], However, Rigos & Smith[12], described the void of data in the literature showing a clinical effect of OTC in fish that could be directly predicted, correlated, or assessed from OTC concentrations in the blood.
OTC is approved by the US Food and Drug Administration (FDA) as an oral antibacterial to treat many bacterial infections in terrestrial animals and humans. It is also approved under the trade name, Terramycin® 200 for Fish (Phibro Animal Health) to treat specific diseases in salmonids, catfish, and lobster[13] (Table 1).
Table 1: US FDA-approved oxytetracycline-medicated feed treatments fordiseases in aquatic species.
| Animal species | Indication | Dose |
|---|---|---|
| Salmonids | Control of furunculosis caused by Aeromonas salmonicida, ulcer disease caused by Hemophilus piscium, bacterial hemorrhagic septicemia caused by A. liquefaciens, and pseudomonas disease | 2.5 - 3.75 g/100 lbs. of fish/day for 10 days |
| Freshwater-reared salmonids | Control of mortality due to coldwater disease associated with Flavobacterium psychrophilum | 3.75 g/100 lb/day for 10 days |
| All freshwater-reared rainbow trout | Control of mortality due to columnaris disease associated with F. columnare | 3.75 g/100 lb/day for 10 days |
| Catfish | Control of bacterial hemorrhagic septicemia caused by A. liquefaciens and pseudomonas disease | 2.5 - 3.75 g/100 lbs. of fish/day for 10 days |
| Lobsters | Control of gaffkemia caused by Aerococcus viridans | 1 g/lb medicated feed for 5 days |
| Pacific salmon | Marking of skeletal tissue | 250 mg/kg of fish/day for 4 days |
Furunculosis is a septicemic disease principally in salmonids and was first described in 1894[14]. Furunculosis is enzootic in many hatcheries, is horizontally transmitted, and as with many diseases pathogenicity can be exacerbated by poor water quality and environmental stress[15]. The disease can be prevented and controlled however, through good husbandry practices and treatment.
As the aquaculture industry expands, questions arise concerning the consequences of antimicrobial use. Since drugs like OTC are incorporated into feed that is dispersed into the water, there is some likelihood of a resulting selective pressure in the exposed ecosystem[16]. Researchers have documented the emergence of antimicrobial resistance in the environment following use of antimicrobial agents in aquaculture[17-22]. Haphazard antimicrobial use in aquaculture should be avoided, and prudent use guidelines[23] discourage using antimicrobials for chemoprophylaxis. Instead, a full identification and characterization of the causative agent in the early stages of an outbreak, including an antibiogram, will better inform veterinarians on recommended treatment options. The M31-A3 Approved Guideline published by the Clinical and Laboratory Standards Institute states, “It is important to consider that the judicious use of antimicrobials in the veterinary setting is directly related to the interpretive criteria associated with AST in that a given set of interpretive criteria only applies to that specific antimicrobial and disease combination. It is also important to note that interpretive criteria… apply only if the laboratory has conducted susceptibility testing according to the specific methods found in the documents”[24].
In 2008, the CLSI’s Subcommittee on Veterinary Antimicrobial Susceptibility Testing approved the first internationally-accepted interpretive criteria for a bacterial pathogen of fish (oxytetracycline and oxolinic acid for A. salmonicida). Interpretive criteria, or more commonly termed clinical breakpoints, are established using:
1) susceptibility frequency distributions for a large number of isolates resulting in epidemiologic cutoff values (ECVs),
2) target animal pharmacokinetics/pharmacodynamics (PK/PD) studies, and
3) correlations of susceptibility test results with clinical outcome reports and/or data. The latter two requirements are addressed in the present study to attempt to correlate with, and complement, susceptibility frequency distribution data presented previously by Miller, et al.[25], Smith, et al.[26], Douglas, et al.[27].
Two studies were conducted in this work. The objective of the “Efficacy Study” was to confirm the effectiveness of OTC against an experimental infection caused by a wild-type A.salmonicida strain in rainbow trout. The objective of the “Parallel Study” was to analyze the absorption of OTC in fish exposed to A.salmonicida and to attempt to correlate the mass transfer of OTC with drug effect.
Materials and Methods
Efficacy study
Animals: Seventy-two rainbow trout (Oncorhynchus mykiss) were obtained from Casta Line Trout Farm in Goshen, VA. There was no reported history of furunculosis at this facility. We placed three fish in separate compartments using a ventilated polycarbonate box within 24 and 60 L aquaria. The 24 L aquaria had a flow-through water supply maintained at 12 - 13°C. We allowed fish to acclimate to their tanks for 3 days, and did not provide feed during acclimation.
Study design: We randomly assigned tanks to two treatment groups (challenged/non-medicated and challenged/medicated) using a randomized block design (Figure 1). Fish were observed at least twice daily throughout the study.
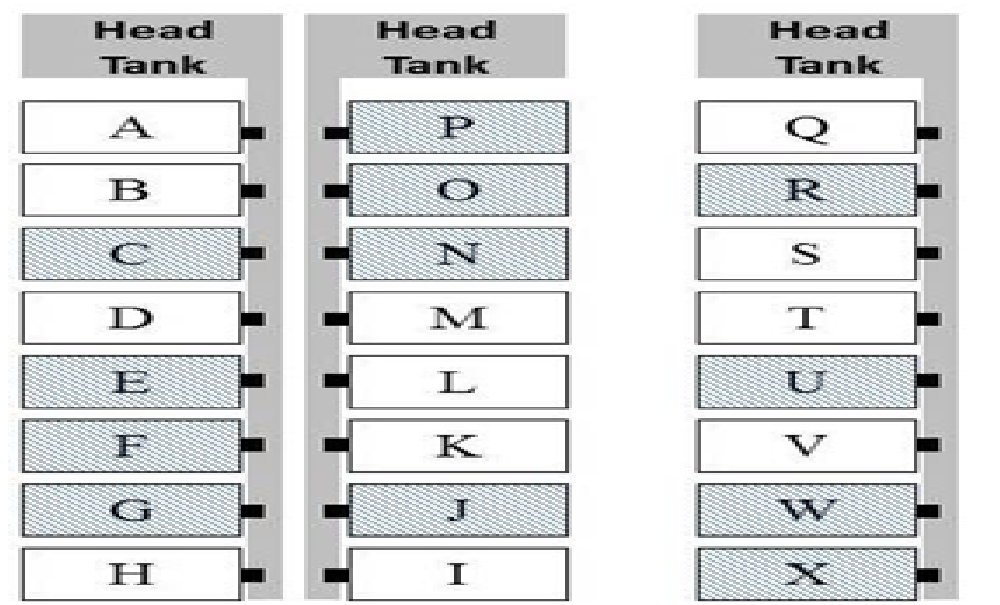
Figure 1: Efficacy study tank assignments - random tank assignment for non-medicated (unshaded) and OTC-medicated (shaded) treatment groups.
OTC-medicated and control feed: We used OTC (dihydrate salt) medicated (8.8 g OTC/kg feed) trout production feed and non-medicated trout product ion feed (Rangen Inc., Buhl, ID). According to the manufacturer identical crude protein, fat, fiber, ash, and phosphorus levels were present in both feeds. Covance Laboratories Inc. (Madison, WI) used a high performance liquid chromatography method to determine the potency of the OTC (dihydrate salt) feed (8140 mg/kg) and control feed (< 2 mg/kg). Feed analyses were completed within 3 months of use, and the results were used in dose calculations. Treatment and control feeds were homogenized in separate blenders, and stored in containers covered by aluminum foil and away from light to minimize photodegradation of OTC.
A. salmonicida challenge strain: A. salmonicida subsp. salmonicida Maine 91 (CVM 33722) was originally isolated in 1991 from salmon in Maine, and was later found to be virulent in rainbow trout[28]. It was confirmed to be a ‘typical’ strain previously using PCR primers specific for A. salmonicida subsp. salmonicida[25]. To confirm the virulence of this strain we sequentially infected six 150 - 300 g rainbow trout. We prepared a bacterial suspension equivalent to a 0.5 McFarland standard [1-2 x 10[8] colony forming units (CFU)/mL] and inoculated fish intraperitoneally with 0.5 mL of the suspension. Within 2 - 3 days, fish succumbed to infection and the isolate was aseptically retrieved in near pure culture from the spleen on tryptic soy agar (TSA) with 5% sheep blood after 44 - 48 h incubation at 22°C. Once in pure culture, the in vivo passage was repeated five additional times. The final isolate (CVM 35493) was frozen at -80°C in tryptic soy broth with 30% glycerol.
Dose calculation: Following the 3 days acclimation period, we placed each fish briefly under anesthesia in a 400 mg/L tricainemethanesulfonate (MS-222) solution (Crescent Research Chemicals; Phoenix, AZ) and recorded individual weights. Fish weights were used to calculate the amount of medicated feed needed to target a dose within the FDA-approved range of 55 to 83 mg OTC/kg b.w. Mean fish weights were 153 ± 27 g (median = 152 g) and 151 ± 25 g (median = 150 g) for the non-medicated and the medicated groups, respectively.
Bacterial challenge procedure: Infection of fish with the A. salmonicida challenge strain was accomplished by dermal abrasion using a Dremel® tool under anesthesia[29,30] (Figure 2). We removed scales and epidermis from a 1 x 2 cm area on the epaxial musculature caudal to the dorsal fin. The scales and mucus were gently wiped free from the abraded area. Following dermal abrasion, each fish was returned to their respective tank compartment to recover for 1.5 - 2 h prior to bacterial challenge.
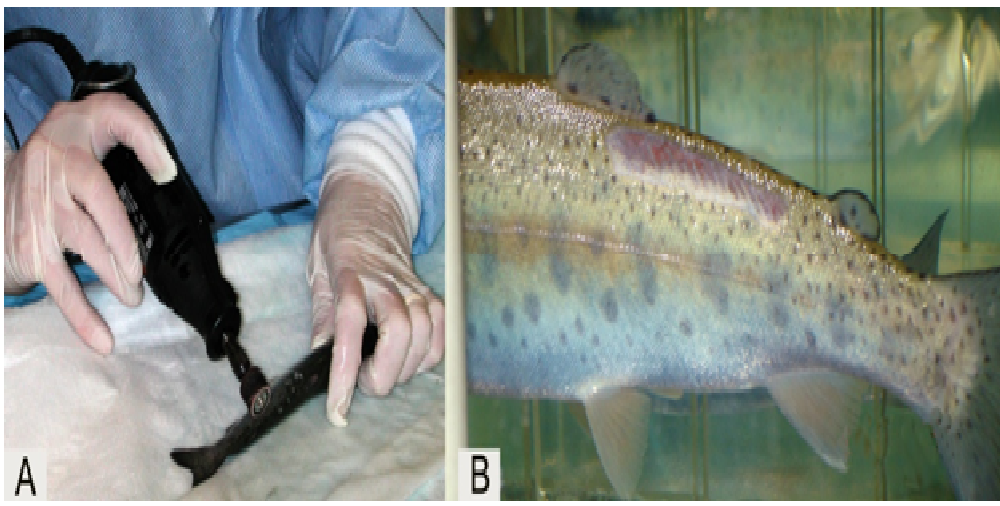
Figure 2: Abrasion method using a Dremel® tool (A) to produce a 1 x 2 cm abraded area (B).
Fifteen 1.8 L brain heart infusion (BHI) broth cultures of A. salmonicida CVM 35493 were grown in 2 L Erlenmeyer flasks incubated at 22°C for 24 h. We pooled these cultures in a 10 L plastic carboy, and took a sub-sample to determine the CFUs/mL of broth. We performed 10-fold serial dilutions of the inoculum in 96-well micro titer plates using 20 μL transfer volumes and 180 μL sterile saline in each well. Four 20 μL drops were placed on TSA with 5% sheep blood, allowed to absorb, and incubated at 22°C for 44 - 48 h. Plate counts resulted in an average of 5.75 colonies/20 μL drop. The inoculum cell density was calculated to be 2.88 x 10⁸ CFU/mL of broth culture by multiplying the colonies/20 μL drop by 50 and the dilution factor of 10-6.
Tank water levels were lowered to 15 cm (~27 L), flow stopped, and 1 L of undiluted A. salmonicida CVM 35493 BHI broth culture was added evenly to the three compartments in each of the 24 tanks. Fish were exposed to a 1 part broth culture (2.88 x 10⁸ CFU/mL A. salmonicida CVM 35493) and 27 parts tank water solution (1:28 dilution or 1.03 x 10⁷ CFU/mL) for 2 h, then water flow was restored to all tanks at 0.75 L/min.
OTC dosing by oral gavage: Two days after bacterial challenge, we briefly anesthetized all fish individually with MS-222 as before, and fed orally by gavage one of the two trout production feeds (Non-medicated and OTC-medicated). Thirty-six fish (12 tanks) received control feed (non-medicated), and another 36 fish received OTC-medicated feed. We packed dry homogenized feed samples into dedicated plastic 3 mL luer-lock syringes with the tip excised and flamed to minimize irritation during insertion and removal (Figure 3). We administered doses by gavage daily for 10 consecutive days using separate anesthesia baths to prevent OTC and/or A. salmonicida cross-contamination. No fish were observed to regurgitate medicated feed during the 10 min observation period. Based upon total feed ingested, administered doses were equivalent to 0.9% b.w. per day. We used mass equivalents for fish fed the control feed (non-medicated group).
The mean dose in the medicated group was 74.5 ± 1.5 mg OTC/kg of fish. Immediately following dosing, each fish was returned to their respective tank compartment to recover.
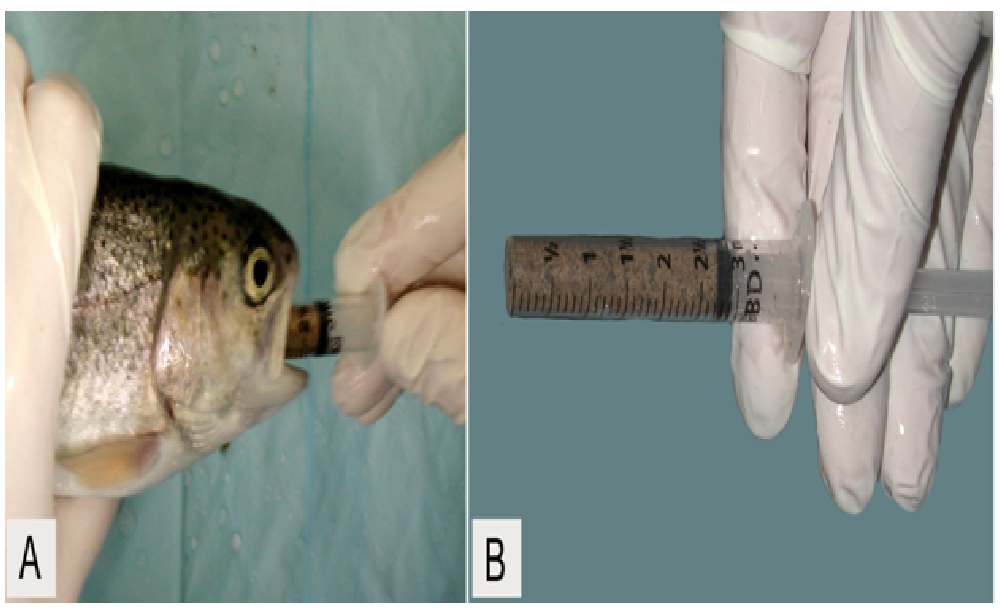
Figure 3: Oral gavage dosing (A) using a 3 mL luer-lock syringe with the end excised (B).
Sampling procedure: Plasma and serum from all moribund and surviving fish were obtained by exsanguination after euthanization with a lethal dose of MS-222. Plasma was also collected from five freshly dead fish. We filled heparinized microhematocrit tubes and centrifuged them at 10,000 RPM for 5 min. We measured total protein (TP, g/dL) using a clinical refract meter (Schuco; Williston Park, NY) and packed cell volumes (PCV, %) or hematocrit using a micro-capillary reader (IEC; Needham Heights, MA). Due to logistical limitations we allowed the remaining blood volume to clot at 4°C overnight. We then centrifuged at 4,000 g for 15 min at 4°C, and collected the serum which we stored at -80°C.
We aseptically removed spleens from dead, moribund, and surviving fish, placed each spleen in 200 μL 0.85% sterile saline, and weighed it to the nearest ten-thousandth of a gram. We homogenized each spleen in a microcentrifuge tube using a sterilized tissue homogenizer with a stainless steel shaft and Teflon pestle (Scientific Laboratory Supplies Inc.; Millville, NH) (Figure 4). We performed 10-fold serial dilutions of the vortex mixed spleen homogenate in a 96-well microtiter plate using 20 μL transfer volumes and 180 μL sterile saline in each well. We placed four 20 μL drops from each dilution step onto a TSA with 5% sheep blood plate, allowed them to absorb, and incubated the plate at 22°C for 44 - 48 h. We multiplied the average colony counts/drop by the dilution factor and then divided by the spleen weight to calculate the CFU/g of spleen. We randomly selected five colonies to streak for isolation and have their susceptibility to OTC determined by broth microdilution.
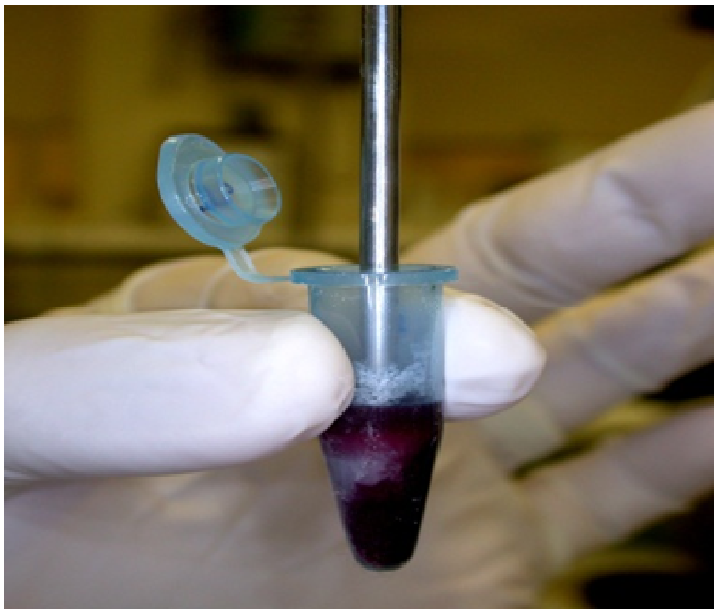
Figure 4: Homogenizing spleen tissue for determination of CFU/g of spleen.
Antimicrobial susceptibility testing: We determined OTC MICs after 44 - 48 h incubation at 22°C using a standardized broth microdilution antimicrobial susceptibility testing method[31,32]. We included quality control organisms Escherichia coli ATCC 25922 and A. salmonicida subsp. salmonicida ATCC 33658 in all tests.
Serum analysis: We used a modified microbiological method similar to the one described by Chen, et al.[33] and Strasdine, et al.[34] for determination of OTC in fish serum. We prepared a Bacillus cereus ATCC 11778 spore suspension in sterile deionized water equivalent to a 3.0 McFarland (9 x 10⁸ CFU/mL) measured on a VITEK colorimeter (Biomerieux Inc.; Durham, NC). We added a 12 mL aliquot of the spore suspension to 250 mL of Antibiotic Medium #8 agar (BD Diagnostic Systems; Sparks, MD) that had been cooled to 45.5°C. After pouring the agar into a 150 mm x 150 mm petri plate, we allowed it to harden for 1.5H. We removed agar wells with a cork borer (diameter = 4.70 mm) connected to a vacuum and placed plates at 4°C for 30 min.
We collected serum from rainbow trout fed non-medicated trout production feed (Rangen Inc.), and used it to prepare fortified OTC calibration standards. We prepared serum standards (8, 4, 2, 1, 0.5, and 0 μg/mL) using a stock 1.00 mg/mL OTC methanolic solution. The 0.5 μg/mL fortification was the lowest detectable fortified concentration. After removing the micro assay plates from 4°C, we added 45 - 50 μL of fortified solutions to each well. We included the series of six fortified standards on three micro assay plates. We used mean zone diameters at each fortification level in regression calculations. We calculated a level of detection (LOD) based on the average zone diameter of a well after 20 - 21 h of incubation (4.29 mm) plus two 2 mm radii (4 mm) since this diameter was the smallest zone of growth inhibition surrounding the well that could be accurately measured. Using the regression equation provided below we calculated a LOD of 0.18 μg/mL.
We thawed incurred serum samples at room temperature, vortex mixed and added 45 - 50 μL to one well per sample. We incubated all test plates at 4°C for 1 h then moved them to a 28°C incubator for 20 - 21 h. We measured diameters of zone of inhibition using digital calipers to the nearest one-hundredth of a mm and used the zone diameters in the corresponding regression equation (based on the regression line in Figure 5), to solve for the serum OTC concentration.
Serum OTC calculations:
[OTC] = log10 0.070 (zone diameter) - 1.326
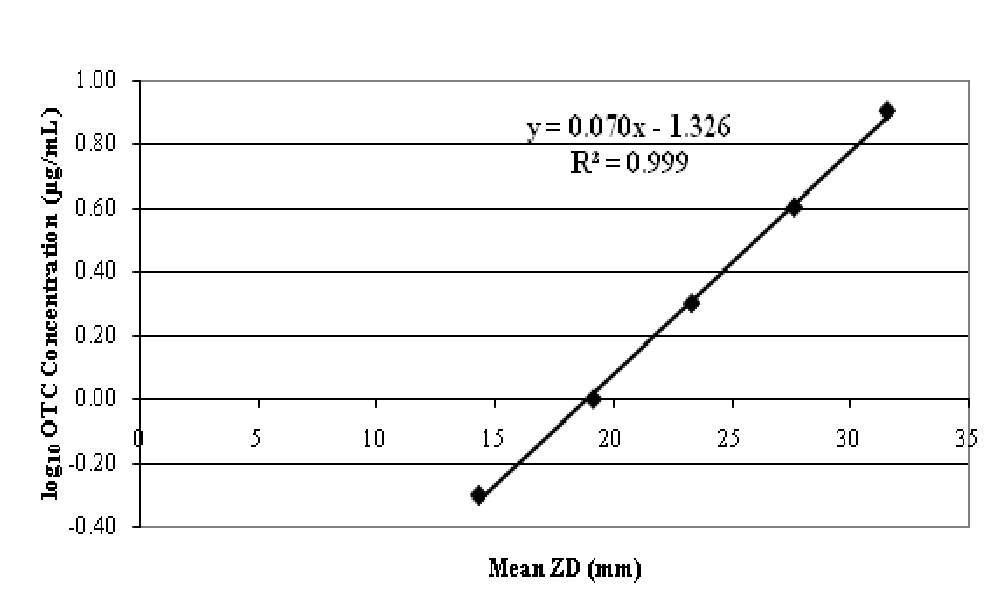
Figure 5: OTC-fortified serum standard data. Linear regression equation was used to extrapolate serum OTC concentrations.
Data analysis: Since each fish was dosed individually and the fish in each tank shared the same water circulation system, each fish as the treatment unit were naturally clustered. The survival time and hazard of death for the fish within the same tank were correlated. To adjust for intra-tank correlation, the Cox marginal model approach by Lee, et al.[34] was used. The regression coefficients were estimated by the maximum partial likelihood under an independent working assumption, and with a robust sandwich covariance estimate to account for the intra-cluster dependence. A common baseline hazard function for each fish in the same tank was assumed. It was assumed that since the fish used were from the same species, there were no survival-related biological differences. To test treatment and potential covariate effects including CFUs, TP, and PCV, models with treatment and one of the potential covariates as a fixed effect were analyzed.
Parallel study
Animals: Seventy-two rainbow trout were obtained from the same source as the Efficacy Study and were allocated to tank compartments identically to that described above.
Study design: We randomly assigned tanks to a pre-dosing sampling group (challenged) and two treatment groups (challenged/non-medicated and challenged/medicated) (Figure 6). We also randomly assigned tanks within each treatment group to a designated sampling day, where all fish in that tank were sacrificed and sampled as described below. The pre-dosing treatment group was comprised of 12 fish total, euthanized one and two days (2 tanks/days) after challenge. In the challenged/non-medicated feed group unplanned sampling of mortalities increased the total number of fish sampled on each pre-determined sampling day (1, 3, 4, 6 days), thus no fish were available to sample on day 10. The challenged/medicated group was comprised of 30 fish, euthanized and sampled 1, 3, 4, 6, and 10 days (six fish/sampling days) after dosing began.
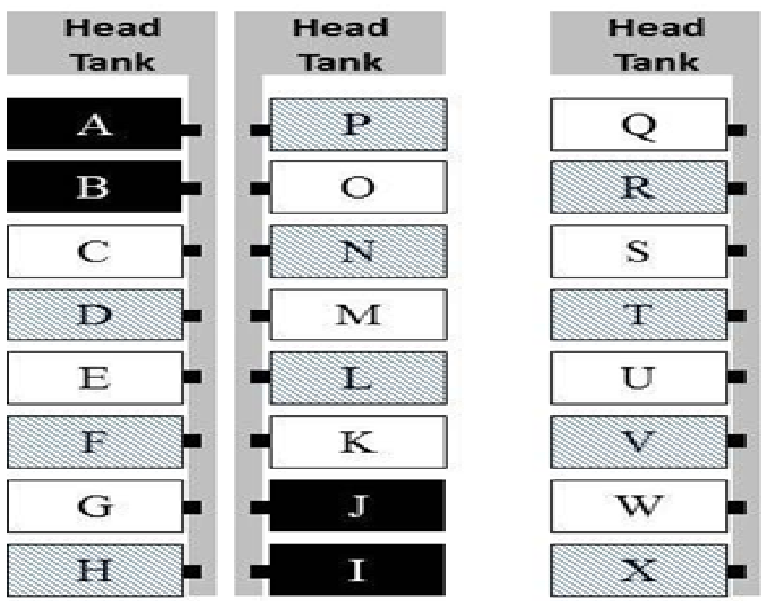
Figure 6: Parallel Study tank assignments - random tank assignment for pre-dosing (black), non-medicated (unshaded), and OTC-medicated (shaded) experimental groups.
OTC-medicated and control feed: Identical lots of feed were used in this and the Efficacy Study.
The A. salmonicida challenge strain: A. salmonicida subsp. salmonicida (CVM 35493) described above was used in this study.
OTC dose calculation: Following a 3 day acclimation period, we weighed fish anesthetized with 400 mg/L MS-222. We used each fish’s weight to calculate the amount of medicated feed needed to target a dose within the FDA-approved range of 55 to 83 mg OTC/kg b.w. The mean fish weight in the non-medicated group was 149 ± 24 g (median = 147 g), in the medicated group it was 137 ± 30 g (median = 127 g), and in the Pre-dose sampling group it was 154 ± 21 g (median = 156 g).
Bacterial challenge procedure: An identical challenge procedure was used as that described above for the Efficacy Study. The inoculum cell density was calculated to be 1.38 x 10⁸ CFU/mL of broth culture.
Fish were exposed to a 4.93 x 10⁶ CFU/mL challenge for 2 h, and then water flow was restored to all tanks at 0.75 L/min.
Dosing by oral gavage: Two days after bacterial challenge, we briefly anesthetized all fish individually with MS-222 as before, and fed orally by gavage one of the two trout production feeds (Non-medicated and OTC-medicated). Thirty fish (10 tanks) received control feed (non-medicated), 30 fish received OTC-medicated feed, and another 12 fish (4 tanks) did not receive any feed and were sacrificed for sampling one day before and on the day dosing began (Pre-dosing group).
The mean dose in the medicated group was 74.7 ± 2.3 mg OTC/kg of fish. Immediately following dosing each fish was returned to its respective tank compartment to recover.
Sampling procedure: The same procedure as that described for the Efficacy Study was used.
Broth microdilution testing: The same procedure as that described for the Efficacy Study was used.
Serum analysis: The same procedure as that described for the Efficacy Study was used.
Pharmacokinetic analysis: Serum OTC concentrations were determined in six trout at each sampling time. Summary statistics were calculated for the concentrations at each sampling time. The AUC up to 240 hours (10 days) after the first dose was calculated as a linear combination of a set of independent random variables using the method described by Bailer[36]. The AUC in A. salmonicida-challenged trout was compared to the AUC determined previously by the same method in healthy rainbow trout[11].
Data analysis: Analysis of data collected via detrimental sampling: TP, PCV, serum OTC concentration, and CFU/g of spleen tissue were collected from 6 fish from two randomly selected tanks at pre-determined sampling time points. Five moribund or dead fish were sampled which were not available for sampling on their predetermined sampling time points. Samples collected at different time points were considered independent from each other, however, samples collected from fish within the same tank were correlated.
A mixed effect model was used to fit the time profile of TP and PCV assuming each response variable followed a Gaussian distribution. The model included treatment, time, and treatment by time as fixed effects and tank as a random effect. If the treatment by time interaction was significant, treatment was compared at each time point. Since the analysis is exploratory in nature, no multiple comparison adjustment was made and the p-values should be considered nominal. Differences in TP and PCV levels between Day 1 and Day 3 in the non-medicated group, between Day 4 and Day 6 in the non-medicated group, between the OTC-medicated group and non-medicated group at day 6, between the OTC-medicated group at Day 10 and pre-dosing group at day -1 and between OTC-medicated group at Day 10 and pre-dosing group at Day 0 were tested based upon an F statistic.
A marginal (i.e., GEE-type) model was used to fit the CFU/g of spleen data. A negative binomial distribution for CFU/g of spleen was assumed and a log link function was used. Survival status at sampling time (i.e., alive or moribund) and one of the two hematologic variables: TP and PCV were considered as a fixed-effect in the model. Under this marginal model, the correlation among fish within the same tank was modeled as a “working” covariance structure. Method of moment was used to estimate the model parameters.
A multivariate analysis was used to estimate correlation coefficients between the serum OTC concentration and the hematologic variables. The two outcome variables were analyzed jointly with a mixed-effect model. The mean function was modeled as a cell-means model that allows for different means for each tank and outcome variables. The covariances were modeled as R-sided directly. The estimated correlation coefficients were further summarized by days post-dosing and treatment group.
Results and Discussion
Efficacy study
Treatment with OTC-medicated feed significantly increased (p < 0.0001) the survivability when compared to the non-medicated group (Figure 7). Percent mortality in the non-medicated fish was 88.9%, whereas in medicated fish it was only 2.8%. All mortalities occurred between 4 and 9 d after bacterial challenge, and all fish had substantial concentrations of A. salmonicida in their spleens (Figure 8). Clinical signs presented as erratic swimming, tachypnea (respiratory distress), darkening of skin, and hemorrhages at the base of the fins. Internally, the presence of ascites and hemorrhage of the abdominal wall and viscera were noted. Serum OTC concentrations in all surviving non-medicated fish sacrificed 14 d after dosing ended were below the LOD (0.18 μg/mL), and four out of 35 surviving medicated fish had low (0.19 - 0.25 μg/mL), but detectable levels of OTC.
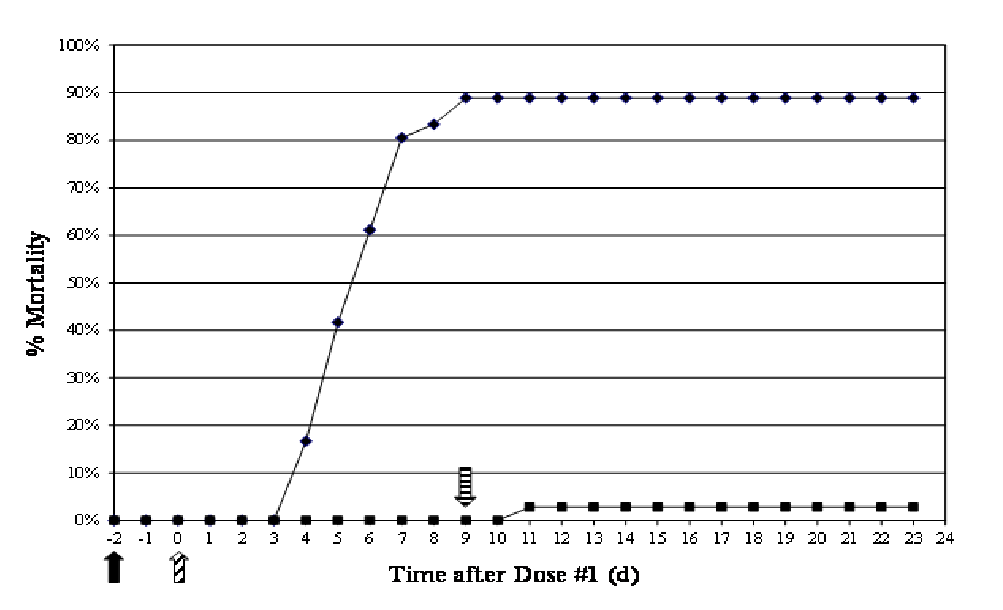
Figure 7: Cumulative percent mortality showing the efficacy of OTC in rainbow trout against an experimental A. salmonicida infection. ♦ Non-medicated; ■ OTC-medicated.  - day of challenge;
  - 1st dose given;
  - 10th dose given.
Infectivity on the order of 105 - 108 CFU/g was found in the spleen in all samples, except those taken from surviving fish at day 23 (Figure 8). Histologically, focal to multi-focal necrosis in the spleen was common in dead fish and those showing signs of clinical disease. The one OTC-medicated fish found dead 11 days after dosing began also had a high concentration of A. salmonicida detected in the spleen. Broth microdilution susceptibility tests of 5 randomly selected isolates from this fish were all resistant to OTC with an MIC of > 32 μg/mL[37]. It is unclear if the isolate is the same challenge strain which acquired a resistance determinant during the study or if the isolate originated from the farm which provided the fish. All 156 A. salmonicida isolates taken from spleens of non-medicated fish revealed no change in the OTC MIC (0.06 – 0.25 μg/mL) from the parent challenge strain CVM 35493 (0.25 μg/mL). Clonality was not addressed with these isolates.
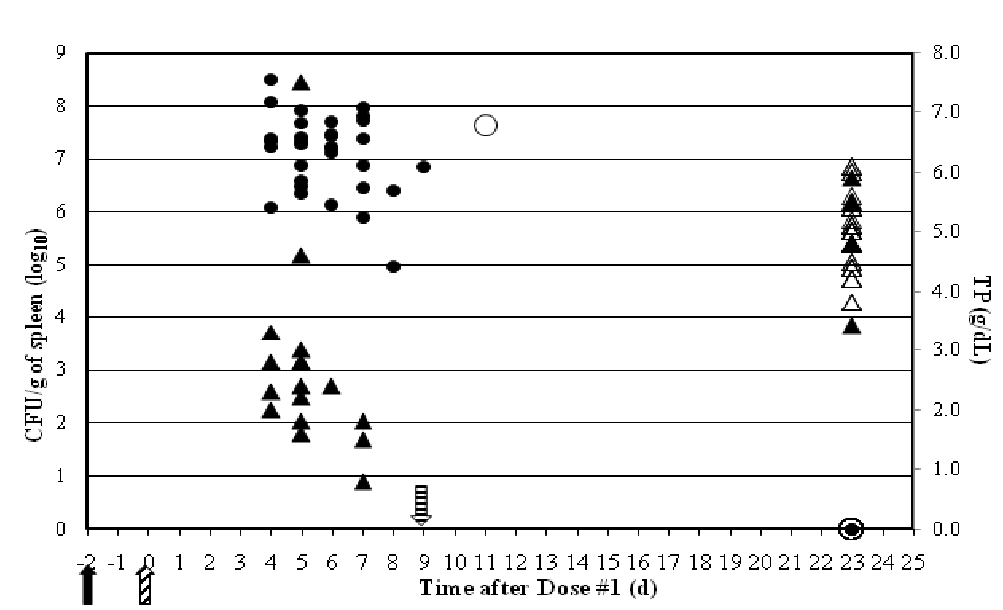
Figure 8: Persistence of A. salmonicida CVM 35493 (left axis, ● CFU/g of spleen from non-medicated fish; ○ CFU/g of spleen from OTC-medicated fish) and hematological effects (right axis, ▲TP from non-medicated fish; Δ TP from OTC-medicated fish) in experimentally infected rainbow trout in rainbow trout over time (- day of challenge; - 1st dose given; - 10th dose given.).
Direct correlations between TP values in moribund and freshly dead fish and A. salmonicida concentrations/g of spleen were easily recognized (Figure 8). Lower TP and PCV values were consistently measured in blood from moribund and freshly dead fish, whereas blood from surviving fish in both treatment groups had higher TP and PCV values. Additionally, in all fish where low TP and PCV values were measured, high concentrations of A. salmonicida were found. These low blood parameters were likely due to an inability to maintain ionic homeotasis which is critical to the survival of all fish species. Loss of Na+- K+-ATPase, a membrane-bound enzyme that actively transports Na+ out of the cells and K+ into the cells is likely responsible for the osmoregulatory dysfunction seen in this study[38].
Parallel Study
Aeromonas salmonicida was not found in spleens from any OTC-medicated fish (Figure 9). A. salmonicida was detected in spleens of non-medicated fish 1 day (1/6 fish), 3 days (3/7 fish), 4 days (7/9 fish), and 6 days (6/8 fish) after dosing began. Generally higher concentrations of bacteria/g of spleen were detected in dead and moribund fish than in those fish sacrificed on their designated sampling day.
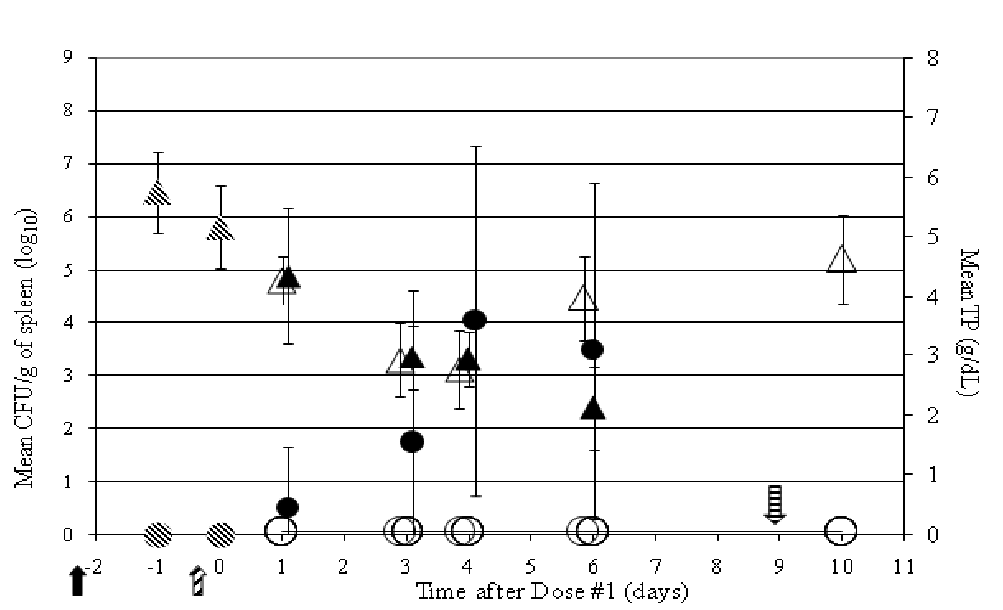
Figure 9: Persistence of A. salmonicida CVM 35493 (left axis,  CFU/g of spleen from pre-dosing fish; ● CFU/g of spleen from non-medicated fish; O CFU/g of spleen from OTC-medicated fish) and hematological effects (right axis,
  Mean TP pre-dosing fish; ▲ Mean TP non-medicated fish; Δ Mean TP OTC-medicated fish) in experimentally infected rainbow trout in rainbow trout over time (- day of challenge; - 1st dose given; - 10th dose given.).
The plots of mean TP values in non-medicated and OTC-medicated fish show a very similar trend until 6 days after dosing began (Figure 9). No significant differences in mean TP values were observed 1, 3, or 4 days after dosing began. A gradual decline in the health of the non-medicated fish began with four mortalities (1 at 3 days, 2 at 4 days, 1 at 6 days) and one moribund fish at 4 days. A significant decrease in mean TP values (p < 0.0013) from 1 to 3 days after dosing began indicated a decline in osmoregulatory function in non-medicated fish. A critical period during this study was between 4 and 6 days after dosing began when mean TP concentrations only (not PCV values) in non-medicated fish declined significantly (p < 0.0326), while TP concentrations in medicated fish increased markedly (not significant). Also at 6 days mean TP values were significantly higher in the medicated fish versus the non-medicated fish (p < 0.0001) confirming a positive effect was afforded by administration of the OTC-medicated feed. TP concentrations in medicated fish at 10 days were significantly lower (p < 0.0076) than those from fish sacrificed 1 day after bacterial challenge and before dosing, however they appeared to be in the late stages of recovery to normal osmoregulatory function. Note that these comparisons are exploratory in nature. The p-values should be considered nominal. However, the magnitude of these p-values does help identify trends or signals to some extent and promote future test hypotheses.
Also with the gradual decrease in mean TP concentrations in non-medicated fish came a gradual increase in the levels of A. salmonicida recovered in the spleen starting 1 day after dosing began (Figure 9). Similar to what was observed in the Efficacy Study, the major decrease in TP values after challenge was probably due to sepsis in the animal, liver malfunction, and proteinemia, resulting in an inability to regulate ion transport. However, one can postulate that the initial decrease in TP concentrations from one to two days after challenge may be due to the dermal abrasion and/or stress. Medicated fish TP concentrations declined throughout the study until mean serum OTC concentrations approached 0.5 μg/mL (Figure 10). Again, the decline in TP concentrations cannot be explained solely based on the sepsis assumption however, since no A. salmonicida were detected in the spleen in medicated fish.
As the CFU/g of spleen data are over dispersed and highly skewed, the distribution of this variable was assumed following a negative binomial distribution. A marginal GEE-type model was used to estimate the fixed effects of survival status at sampling and one of the hematologic variables. The correlation among fish sharing a tank was accounted for by using a working covariance structure. TP was a significant predictor of CFU/g of spleen (p < 0.0001). However, PCV alone was not a significant predictor of CFU/g of spleen.
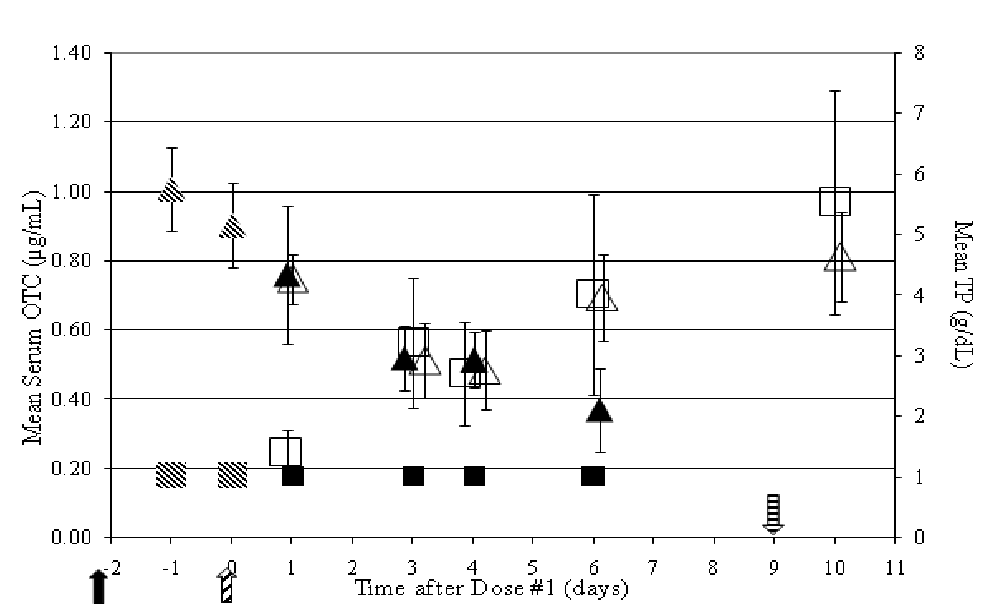
Figure 10: Relationship between mean serum OTC concentrations (left axis,  pre-dosing fish; ■ non-medicated fish;
  OTC-medicated fish) and mean TP (right axis, pre-dosing fish; ▲ non-medicated fish; Δ OTC-medicated fish) in experimentally infected rainbow trout over time ( - day of challenge; - 1st dose given; - 10th dose given.).
The continuous variables including TP and PCV approximately follow a Gaussian distribution. A mixed effect model was used to test the overall treatment effect and the treatment effect at each sampling time point, if any, for each of the variables. TP showed significant time (p < 0.001) and treatment*- time effects (p < 0.001), but not PCV. A significant treatment effect is demonstrated on Day 6 for TP per the unadjusted P-values. TP is a more sensitive biomarker of treatment effect, and under these test conditions, Day 6 was the optimal time to detect a treatment effect with the biomarker TP. These test results show that TP might be useful as a biomarker for treatment effect to help design appropriate dosing regimens in fish.
The individual and mean serum OTC concentrations in A. salmonicida-challenged rainbow trout (Parallel Study) and healthy rainbow trout[11] are shown in (Figure 11). The estimated AUC was 140.0 h•μg/mL in challenged rainbow trout and was lower than the estimated AUC of 172.8 h•μg/mL in healthy rainbow trout; the variances were 126.4 and 30.4, respectively.
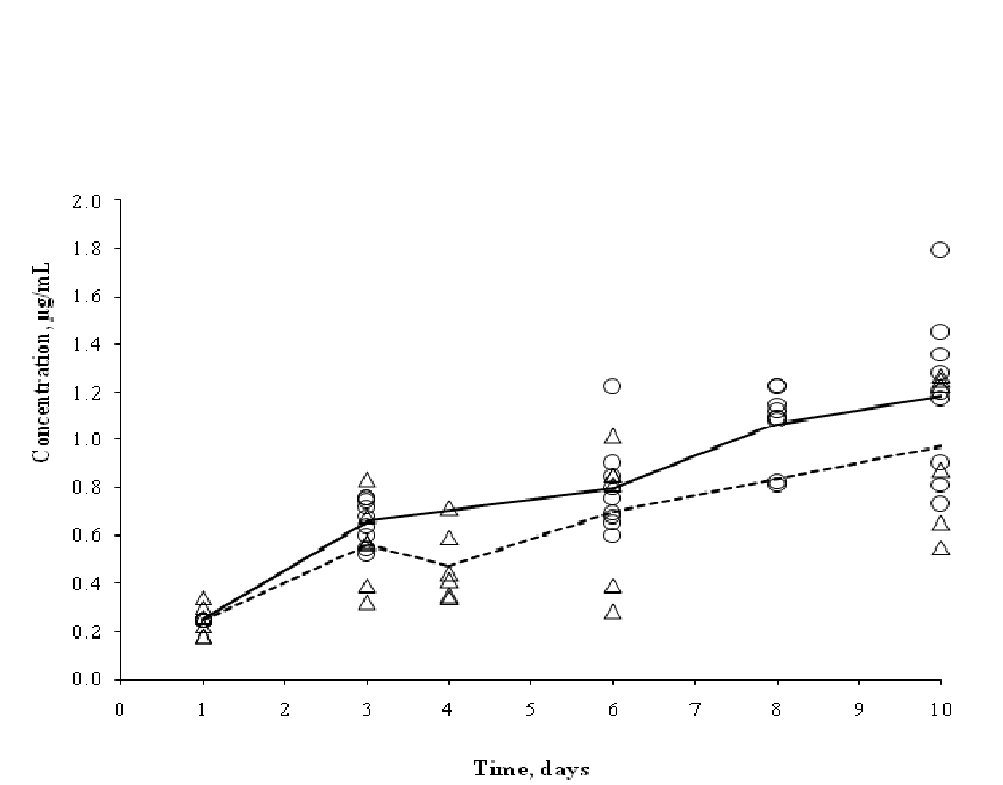
Figure 11: Individual and mean serum OTC concentrations in A.salmonicida-challenged rainbow trout (Δ, dashed line) from the Parallel Study and healthy rainbow trout( O, solid line) from Miller et al.[11]
The decreased AUC value in dermal abraded and challenged fish may be due to decreased bioavailabilty of the OTC-medicated feed in the gastrointestinal tract. We found most GI tracts of fish sampled to be full of feed indicating a decrease in gastric emptying possibly due to bacterial challenge and/or stress. Bioavailability was not determined in this study due to difficulties in intravenous administrations in fish, thus the percentage of OTC absorbed from the GI tract could not be calculated.
Alternatively, decreased serum OTC concentrations and the resultant AUC value in the abraded and infected fish (Figure 11) may be explained by increased systemic OTC clearance. It is unclear if any change in clearance is the result of changes in OTC distribution and/or excretion in abraded and infected fish. OTC clearance was not determined in this study because no serum samples were collected during the drug elimination phase post-dosing. From a drug distribution standpoint, loss of osmoregulatory function leading to an increased plasma volume with a decreased TP may help explain some lower serum OTC concentrations. Additional studies aimed at comparing TP and PCV values in dermally abraded and unabraded rainbow trout fed OTC-medicated feed with and without bacterial challenge are needed to prove an effect of bacterial challenge and/or dermal abrasion on hemodilution of OTC in serum. TP values in serum should also be determined since Hrubec & Smith[39] found significantly higher TP concentrations in rainbow trout and catfish serum than in plasma.
Many authors have described varying degrees of anemia associated with bacterial infection of salmonids. Waagbø, et al.[40] reported hypoproteinemia and a reduction in red blood cells, hematocrit and hemoglobin in Atlantic salmon suffering from Hitra disease. Barham, et al.[41] also reported hypoproteinemia and a reduction of hemoglobin and hematocrit in rainbow trout infected with Aeromonas spp. and Streptococcus spp. A decrease in TP in the serum of brown trout and Atlantic salmon with ulcerative dermal necrosis, and a single fungal infection Saprolegniaferax, was reported by Mulcahy.[42] Řehulka[43] reported hypoproteinemia to correspond with a histological finding in kidney and acute hepatitis, which are mainly characterized by the loss of albumin and a decrease in its synthesis. Albumin contributes to maintaining colloidal osmotic pressure in the blood flow. Řehulka also showed hypoalbuminemia can lead to swelling and ascites.
A multivariate analysis of serum OTC concentration and one of the hematological variables was performed with a mixed effect model to estimate the correlation coefficients between the two variables. There is a positive correlation between the serum OTC concentration and TP levels at Day 1. On Day 3 and 4, the direction of the correlation is inconsistent and the magnitude of the correlation coefficients is small. On Day 6, there is an obvious negative correlation. Ten days after the first dose, the range of the correlation coefficients covers zero and the direction of the correlation could be positive or negative. The correlation between the serum OTC concentration and PCV are positive on Days 1, 6 and 10 and slightly negative on Day 3 and 4. The correlation coefficients between OTC and PCV are also smaller than those between serum OTC concentration and TP. In summary, there is a stronger correlation between serum OTC concentration and TP than to PCV. Thus, TP could be a promising biomarker because it is a good indicator of treatment effect, is a significant predictor of CFU/g of spleen, and is highly correlated with the serum OTC concentration at Day 1 and Day 6.
Conclusion
This study provided some validation for the CLSI clinical breakpoints for OTC and A. salmonicida (Susceptible ≤ 1 μg/mL; Intermediate 2 - 4 μg/mL; Resistant ≥ 8 μg/mL).[28] An experimental infection model using an A. salmonicida isolate with an MIC = 0.25 μg/mL responded favorably to the FDA-approved OTC dosing regimen. Additional studies are needed to investigate the clinical efficacy of OTC in rainbow trout against infections caused by A. salmonicida isolates with higher MICs (1 - 4 μg/mL) and will provide useful information related to the accuracy of the current CLSI clinical breakpoints.
Lastly, there was a clear correlation between serum OTC concentration and the osmoregulatory status of the fish. Once serum OTC concentrations accumulated to levels greater than the MIC of the challenge strain 3 and 4 days after the first dose, the osmoregulatory function began to improve and became significantly better on day 6.
Additional research is needed to investigate the pharmacokinetic and pharmacodynamic relationships of antimicrobials used in aquaculture.
Acknowledgement:
This work was supported in part by the Oak Ridge Associated Universities through a grant sponsored by the FDA. We would like to thank Christie Decker, Mark McDonald, and Sam Howard for maintaining the animals used in this work. Reference to trade names does not imply endorsement by the U.S. Government.
Disclaimers:
There were no conflicts of interest among the authors on this paper. The views expressed in this article are those of the authors and may not reflect the official policy of the Department of Health and Human Services, the U.S. Food and Drug Administration, or the U.S. Government. The experimental protocol was approved by the Animal Care and Use Committee at the Office of Research, Center for Veterinary Medicine, U.S. Food and Drug Administration, and all procedures were conducted in accordance with the principles stated in the Guide for the Care and Use of Laboratory Animals (2011) and the Animal Welfare Act of 1966 (P.L. 89-544), as amended.
References
- 1. Sangrungruang, K., Chotchuang, A., Ueno, R. Comparative pharmacokinetics and bioavailability of oxytetracycline in giant tiger prawn. (2004) Fisheries Sci 70(3): 467-472.
- 2. Reed, L.A., Siewicki, T.C., Shah, J.C. The biopharmaceutics and oral bioavailability of two forms of oxytetracycline to the white shrimp, Litopenaeus setiferus. (2006) Aquaculture 258: 42-54.
- 3. Uno, K., Aoki, T., Kleechaya, W., et al. Pharmacokinetics of oxytetracycline in black tiger shrimp, Penaeus monodon, and the effect of cooking on the residues. (2006) Aquaculture 254: 24-31.
- 4. Gómez-Jimenez , S., Espinosa-Plascencia , A. Oxytetracycline (OTC) accumulation and elimination in hemolymph, muscle and hepatopancreas of white shrimp Litopenaeus vannamei following an OTC-feed therapeutic treatment. (2008) Aquaculture 274(1): 24-29.
- 5. Faroongsarng, D., Chandumpai, A., Chiayvareesajja, S., et al. Bioavailability and absorption analysis of oxytetracycline orally administered to the standardized moulting farmed Pacific white shrimps (Penaeus vannamei). (2007) Aquaculture 269: 89-97.
- 6. Harms, C.A., Papich, M.G. Pharmacokinetics of oxytetracycline in loggerhead sea turtles (Carettacaretta) after single intravenous and intramuscular injections. (2004) J Zoo Wildl Med 35(4): 477-488.
- 7. Haug, T., Hals, P.A. Pharmacokinetics of oxytetracycline in Arctic charr (Salvelinus alpinus L.) in freshwater at low temperature. (2000) Aquaculture 186(3-4): 175-191.
- 8. Coyne, R., Samuelsen, O.B., Bergh, O., et al. On the validity of setting breakpoint minimum inhibition concentrations at one quarter of the plasma concentration achieved following oral administration of oxytetracycline. (2004) Aquaculture 239(1-4): 23-35.
- 9. Rigos, G., Nengas, I., Alexis, M., et al. Bioavailability of oxytetracycline in sea bass, Dicentrarchus labrax (L.). (2004) J Fish Dis 27(2): 119-122.
- 10. Wang, Q., Liu, Q., Li, J. Tissue distribution and elimination of oxytetracycline in perch Lateolabras janopicus and black seabream (Sparus macrocephalus) following oral administration. (2004) Aquaculture 237(1-4): 31-40.
- 11. Miller, R.A., Pelsor, F.R., Kane, A.S., et al. Oxytetracycline pharmacokinetics in rainbow trout during and after an orally administered medicated feed regimen. (2012) J Aquat Anim Health 24(2): 121-128.
- 12. Rigos, G., Smith, P. A critical approach on pharmacokinetics, pharmacodynamics, dose optimisation and withdrawal times of oxytetracycline in aquaculture. (2013) Reviews in Aquaculture 5: 1-30.
- 13. Center for Veterinary Medicine. Aquaculture. (2016) US FDA – Approved Drugs.
- 14. Bernoth, E.M. 1- Furunculosis: The history of the disease and of disease research. (1997) Furunculosis: Multidisciplinary fish disease research. 1-20.
- 15. Bernoth, E.M., Ellis, A.E., Midtylng, P.J., et al. Furunculosis: Multidisciplinary fish disease research. (1997) Academic Press.
- 16. Food Safety Issues Associated with Products from Aquaculture. (1999) World Health Organ Tech Rep Ser. 883(1-6): 1-55.
- 17. Husevag, B., Lunestad, B.T., Johannessen, P.J., et al. Simultaneous occurrence of Vibrio salmonicida and antibiotic-resistant bacteria in sediments at abandoned aquaculture sites. (1991) J Fish Dis 14(6): 631-640.
- 18. Husevag, B., Lunestad, B.T. Presence of the fish pathogen Aeromonas salmonicida and bacteria resistant to antimicrobial agents in sediments from Norwegian fish farms. (1995) Bull Eur Assoc Fish Path 15(1): 17-19.
- 19. Sathiyamurthy, K., Purushothaman, A., Ramaiyan, V. Antibiotic-resistant Vibrio cholerae in Parangipettai coastal environs, south east India. (1997) Microb Drug Resist 3(3): 267-270.
- 20. Guardabassi, L., Dalsgaard, A., Raffatellu, M., et al. Increase in the prevalence of oxolinic acid resistant Acinetobacter spp. observed in a stream receiving the effluent from a freshwater trout farm following the treatment with oxolinic acid-medicated feed. (2000) Aquaculture 188(3-4): 205-218.
- 21. Huys, G., Gevers, D., Temmerman, R., et al. Comparison of the antimicrobial tolerance of oxytetracycline-resistant heterotrophic bacteria isolated from hospital sewage and freshwater fishfarm water in Belgium. (2001) Syst Appl Microbiol 24(1): 122-130.
- 22. Sorum, H. Antimicrobial drug resistance in fish pathogens. (2006) ASM: 213-238.
- 23. Judicious use of antimicrobials for aquatic veterinarians. (2016) AVMA.
- 24. Performance standards for antimicrobial disk and dilution susceptibility tests for bacteria isolated from animals: Approved Standard M31-A3. (2008) CLSI 28(8).
- 25. Miller, R.A., Reimschuessel, R. Epidemiologic cutoff values for antimicrobial agents against Aeromonas salmonicida isolates determined by minimal inhibitory concentration and diameter of zone of inhibition data. (2006) Am J Vet Res 67(11): 1837-1843.
- 26. Smith, P., Ruane, N.M. Impact of inter-lab variation on the estimation of epidemiological cut-off values for disc diffusion susceptibility test data for Aeromonas salmonicida. (2007) Aquaculture 272(1-4): 168-179.
- 27. Douglas, I., Ruane, N.M., Geary, M., et al. The advantages of the use of discs containing single agents in disc diffusion testing of the susceptibility of Aeromonas salmonicida to potentiated sulphonamides. (2007) Aquaculture 272(1-4): 118-125.
- 28. Bowser, P.R., Wooster, GA. Laboratory efficacy of enrofloxacin for the control of Aeromonas salmonicida infection in rainbow trout. (1994) J Aquat Anim Health 6(4): 288-291.
- 29. Darwish, A.M., Rawles, S.D. Laboratory efficacy of oxytetracycline for the control of Streptococcus iniae infection in blue tilapia. (2002) J Aquat Anim Health 14(3): 184-190
- 30. Gieseker, C., Serfling, S.G. Formalin treatment to reduce mortality associated with Saprolegniaparasitica in rainbow trout, Oncorhynchus mykiss. (2006) Aquaculture 253(1-4): 120-129.
- 31. Miller, R.A., Walker, R.D., Carson, J. Standardization of a broth microdilution susceptibility testing method to determine minimum inhibitory concentrations of aquatic bacteria. (2005) Dis Aquat Org 64(3): 211-222.
- 32. Methods for broth dilution susceptibility testing of bacteria isolated from aquatic animals.VET04-A2. (2014) CLSI 34(14).
- 33. Chen, C.Y., Getchell, R.G., Oxytetracycline residues in four species of fish after 10-day oral dosing in feed. (2004) J Aquat Anim Health 16(4): 208-219
- 34. Strasdine, G.A., McBride, J.R. Serum antibiotic levels in adult sockeye salmon as a function of route of administration. (1979) J Fish Biol 15(1): 135-140.
- 35. Lee, E.W., Wei, L.J. Cox-type regression analysis for large numbers of small groups of correlated failure time observations. (1992) Survival Analysis: State of the Art 211: 237-247.
- 36. Bailer, A.J. Testing for the equality of area under the curves when using destructive measurement techniques. (1988) J Pharmacokinet Biopharm 16(3): 303-309.
- 37. Performance standards for antimicrobial susceptibility testing of bacteria isolated from aquatic animals; Approved Supplement VET03/VET04-S2. (2014) CLSI 34(15).
- 38. Deane, E.E., Woo, N.Y. Evidence for disruption of Na(+)-K(+)-ATPase and hsp70 during vibriosis of sea bream, Sparus (=Rhabdosargus) sarba Forsskal. (2005) J Fish Dis 28(4): 239-251.
- 39. Hrubec, T.C., Smith, S.A. Differences between plasma and serum samples for the evaluation of blood chemistry values in rainbow trout, channel catfish, hybrid tilapias, and hybrid striped bass. (1999) J Aquat Anim Health 11(2): 116-122.
- 40. Waagbø, R., Sandnes, K., Espelid, S., et al. Haematological and biochemical analyses of Atlantic salmon, Salmo salar L., suffering from coldwater vibriosis ('Hitra disease'). (1988) J Fish Dis 11(5): 417-423.
- 41. Barham, W.T., Smit, G.L., Schoonbee, H.J. The haematological assessment of bacterial infection in rainbow trout, Salmo gairdneri Richardson. (1980) J Fish Biol 17(3): 275-281.
- 42. Mulcahy, M.F. Serum protein changes associated with ulcerative dermal necrosis (UDN) in the trout, Salmo trutta L. (1971) J Fish Biol 3(2): 199-201.
- 43. Rehulka, J. Haematological analyses in rainbow trout Oncorhynchus mykiss affected by viral haemorrhagicsepticaemia (VHS). (2003) Dis Aquat Organ 56(3): 185-193.


